
The BNG Pricing Report

The only open analysis of BNG pricing and market trends. Updated quarterly since 2024 with data from 85%+ of available supply. Get insights and explanations of what’s happening across the market.

Complete the form to immediately receive the latest PDF report, plus get all future reports direct to your inbox. We will also send you email updates every few weeks, you can unsubscribe at any time.

Use our free budgeting tool The BNG Price Calculator click here

See data and insights from the July 2026 BNG Pricing Report click here

Example pages from the report:
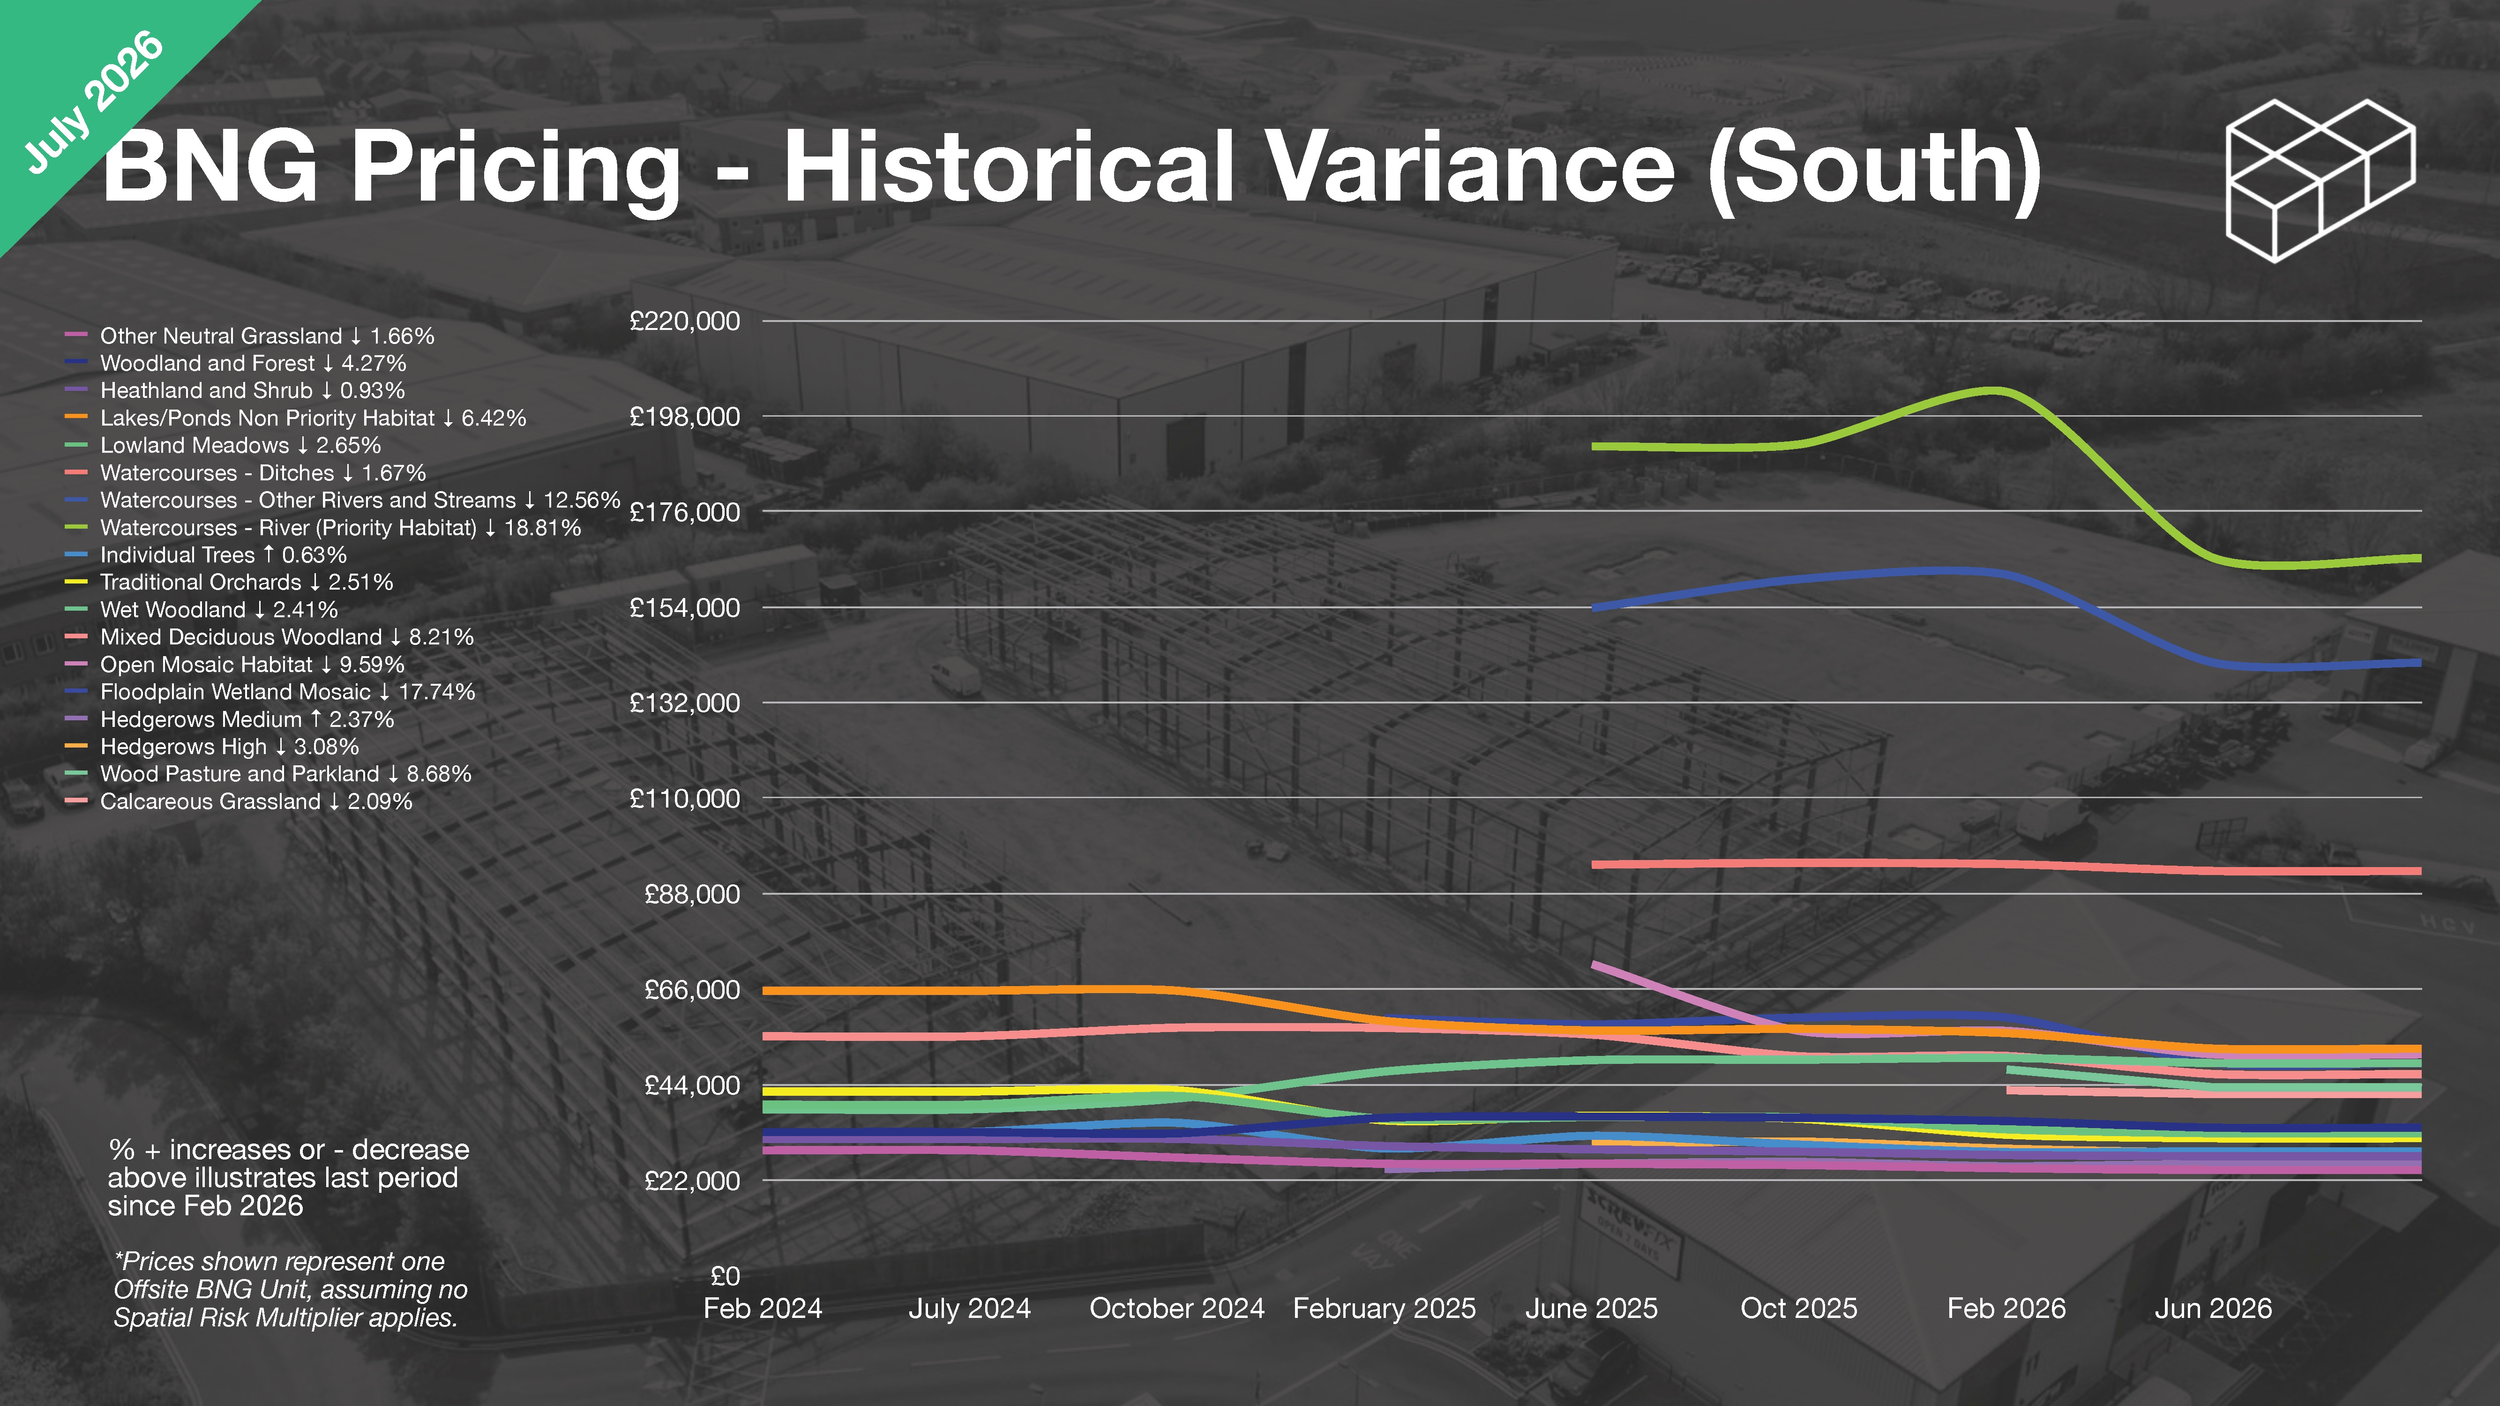
A chart titled 'BNG Pricing - Historical Variance (South)' displays projected real estate prices from February 2024 to June 2026, with various lines representing different types of land and habitat with percentage changes, around a background aerial view of a construction site and industrial area. The chart includes a color legend on the left explaining the land categories and their percentage decline or increase.
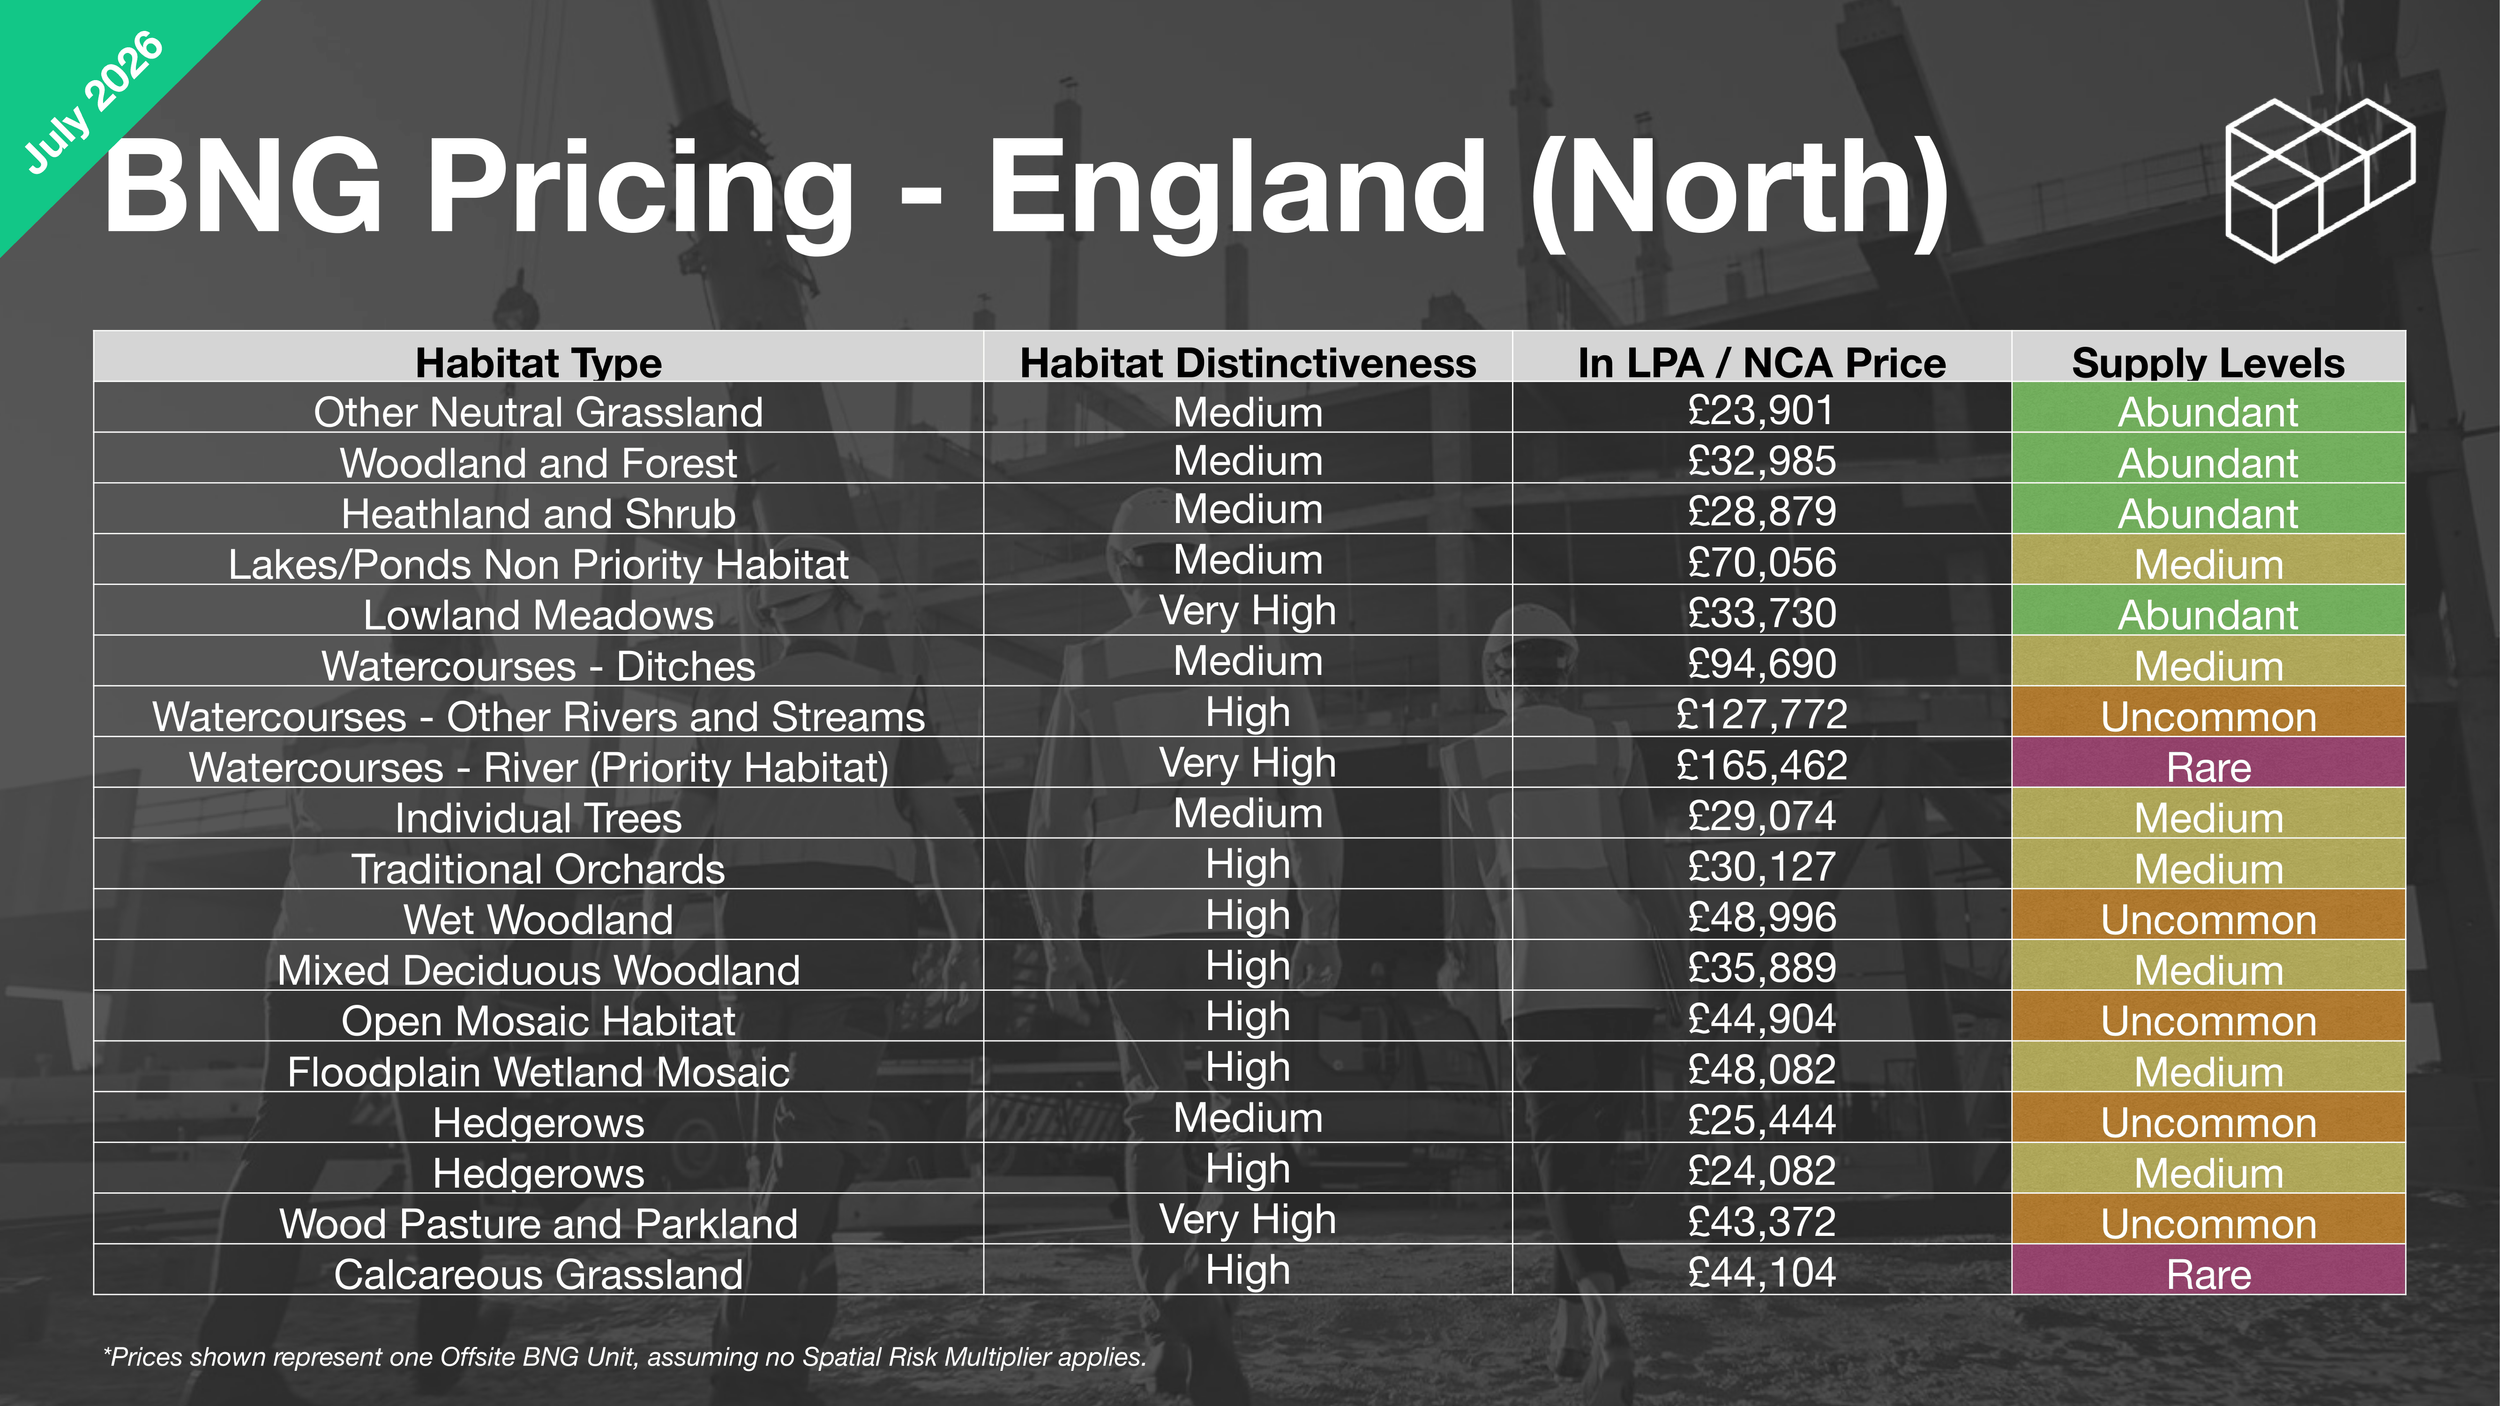
A table displaying BNG wildlife habitat prices and supply levels for England North, with various habitat types, their distinctiveness, prices in GBP, and supply levels marked as abundant, medium, uncommon, or rare. The table includes habitat types like neutral grassland, woodland, heathland, lakes, lowland meadows, watercourses, wetlands, and others, with prices and availability details.
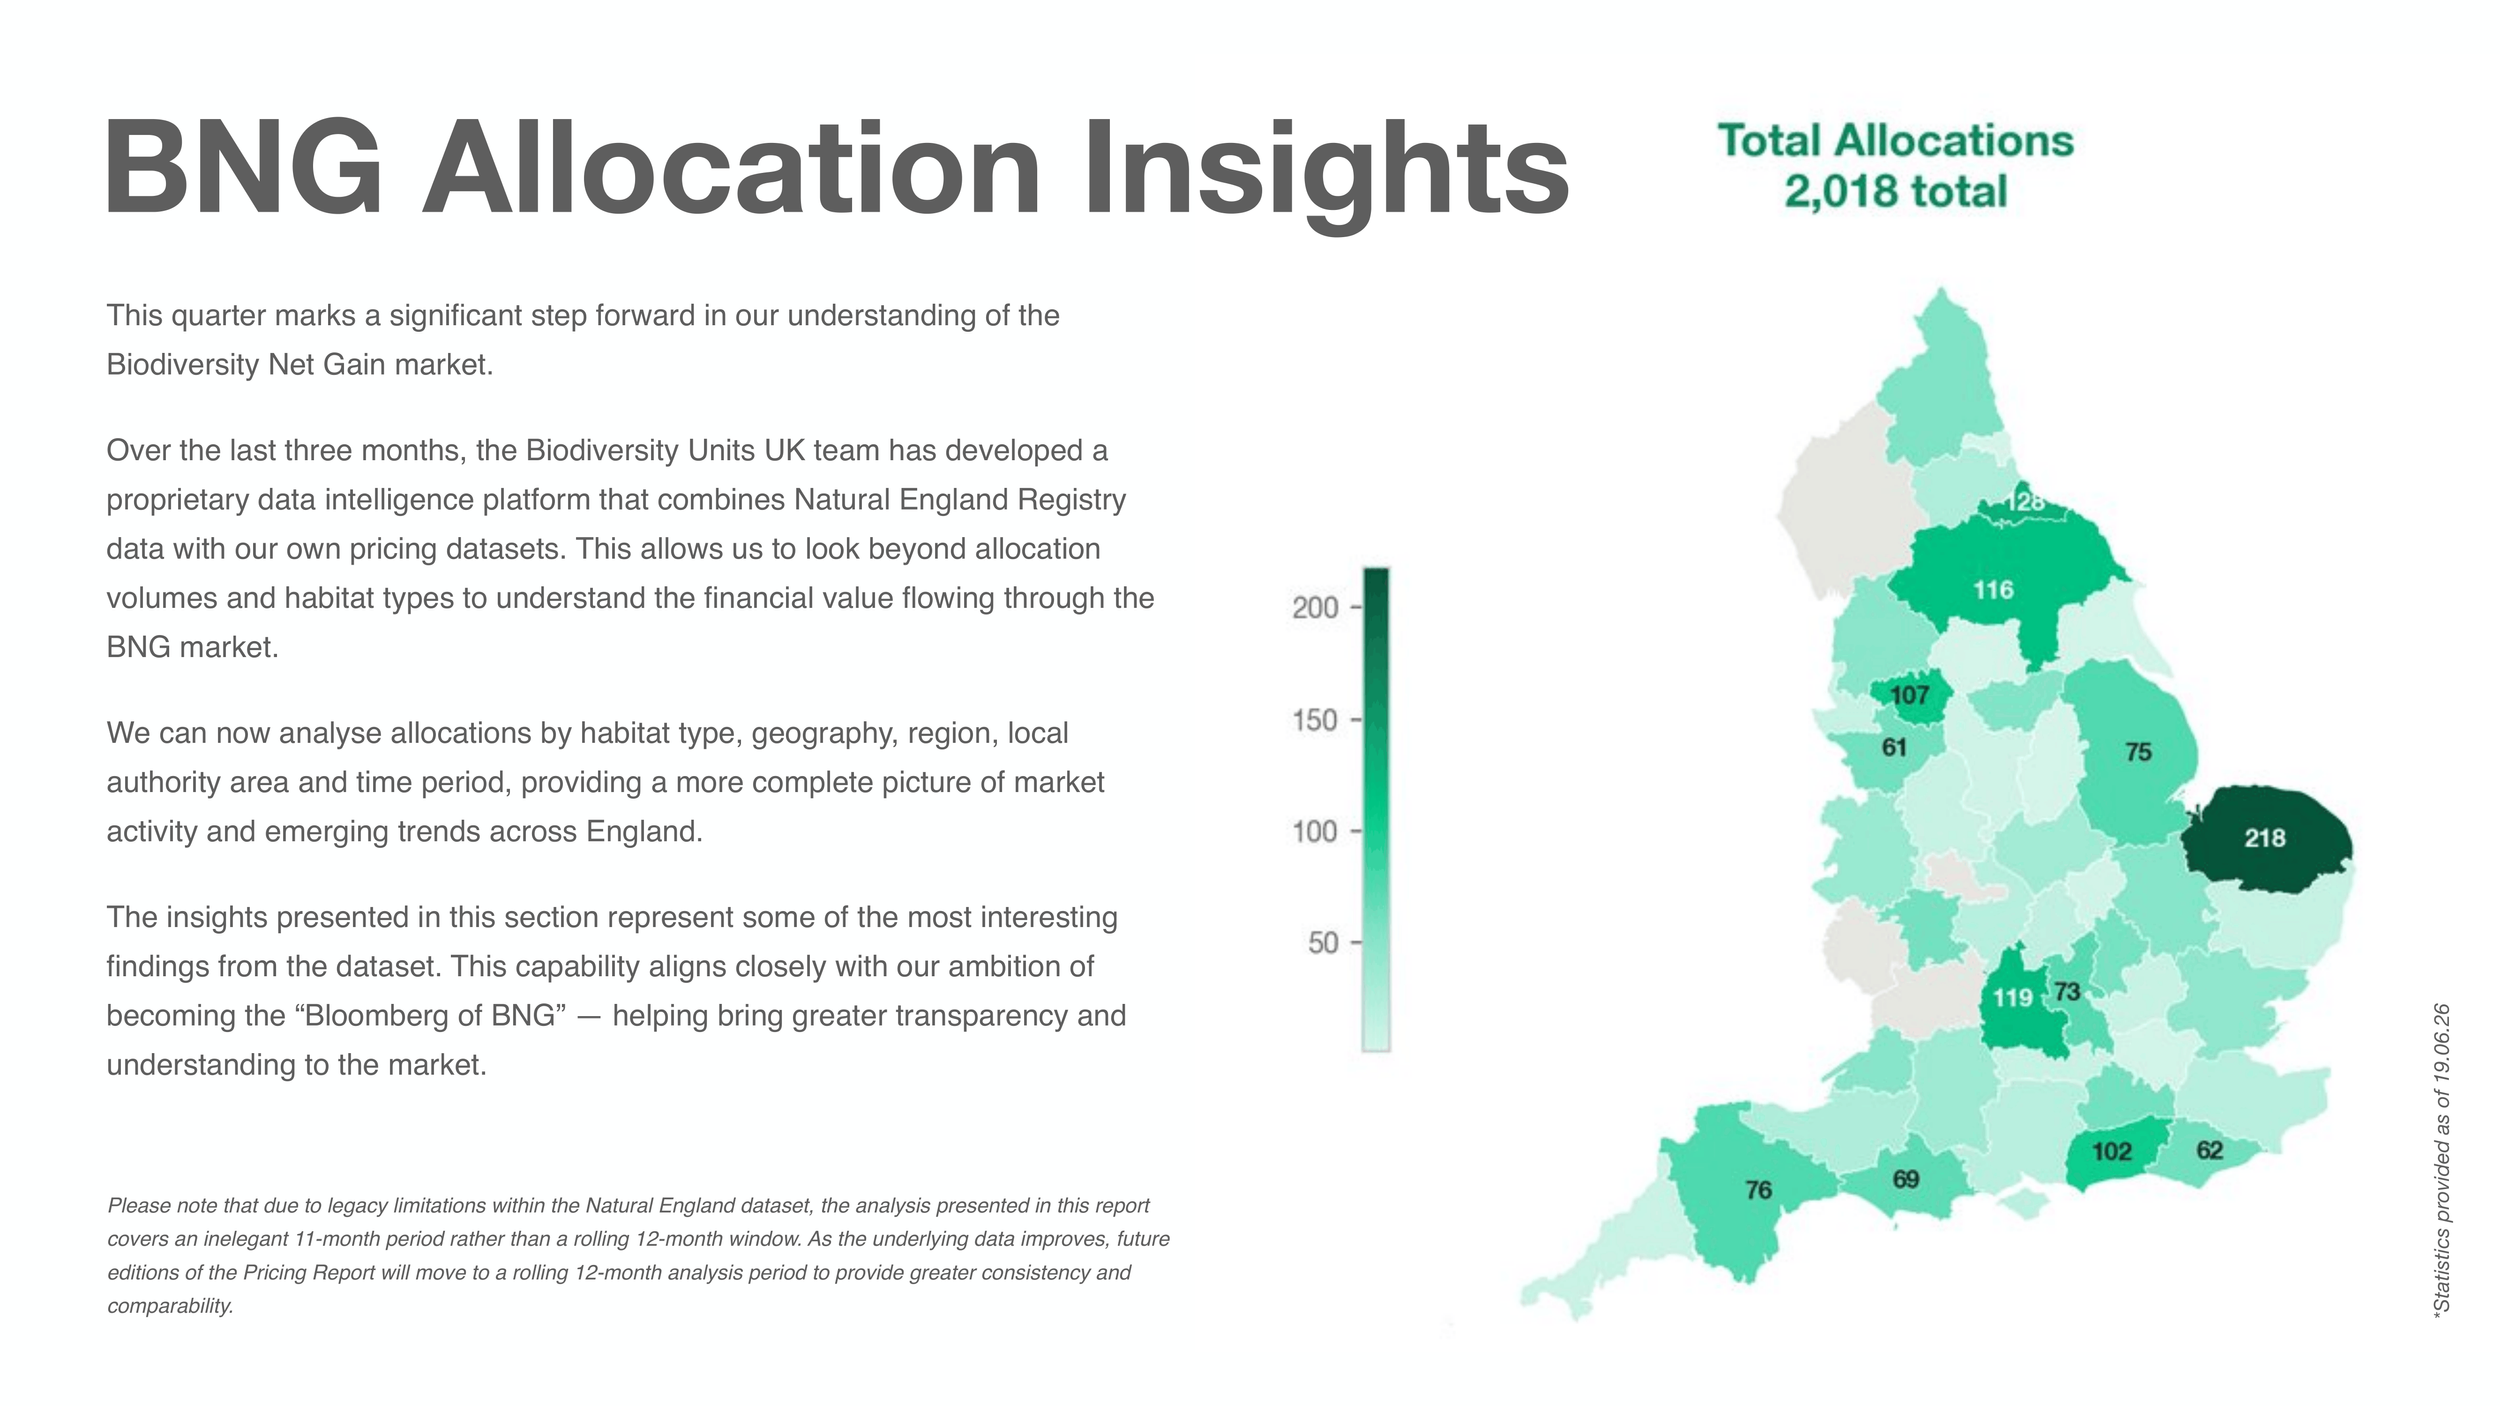
Color-coded map of England with numerical data for different regions, illustrating BNG allocation insights.
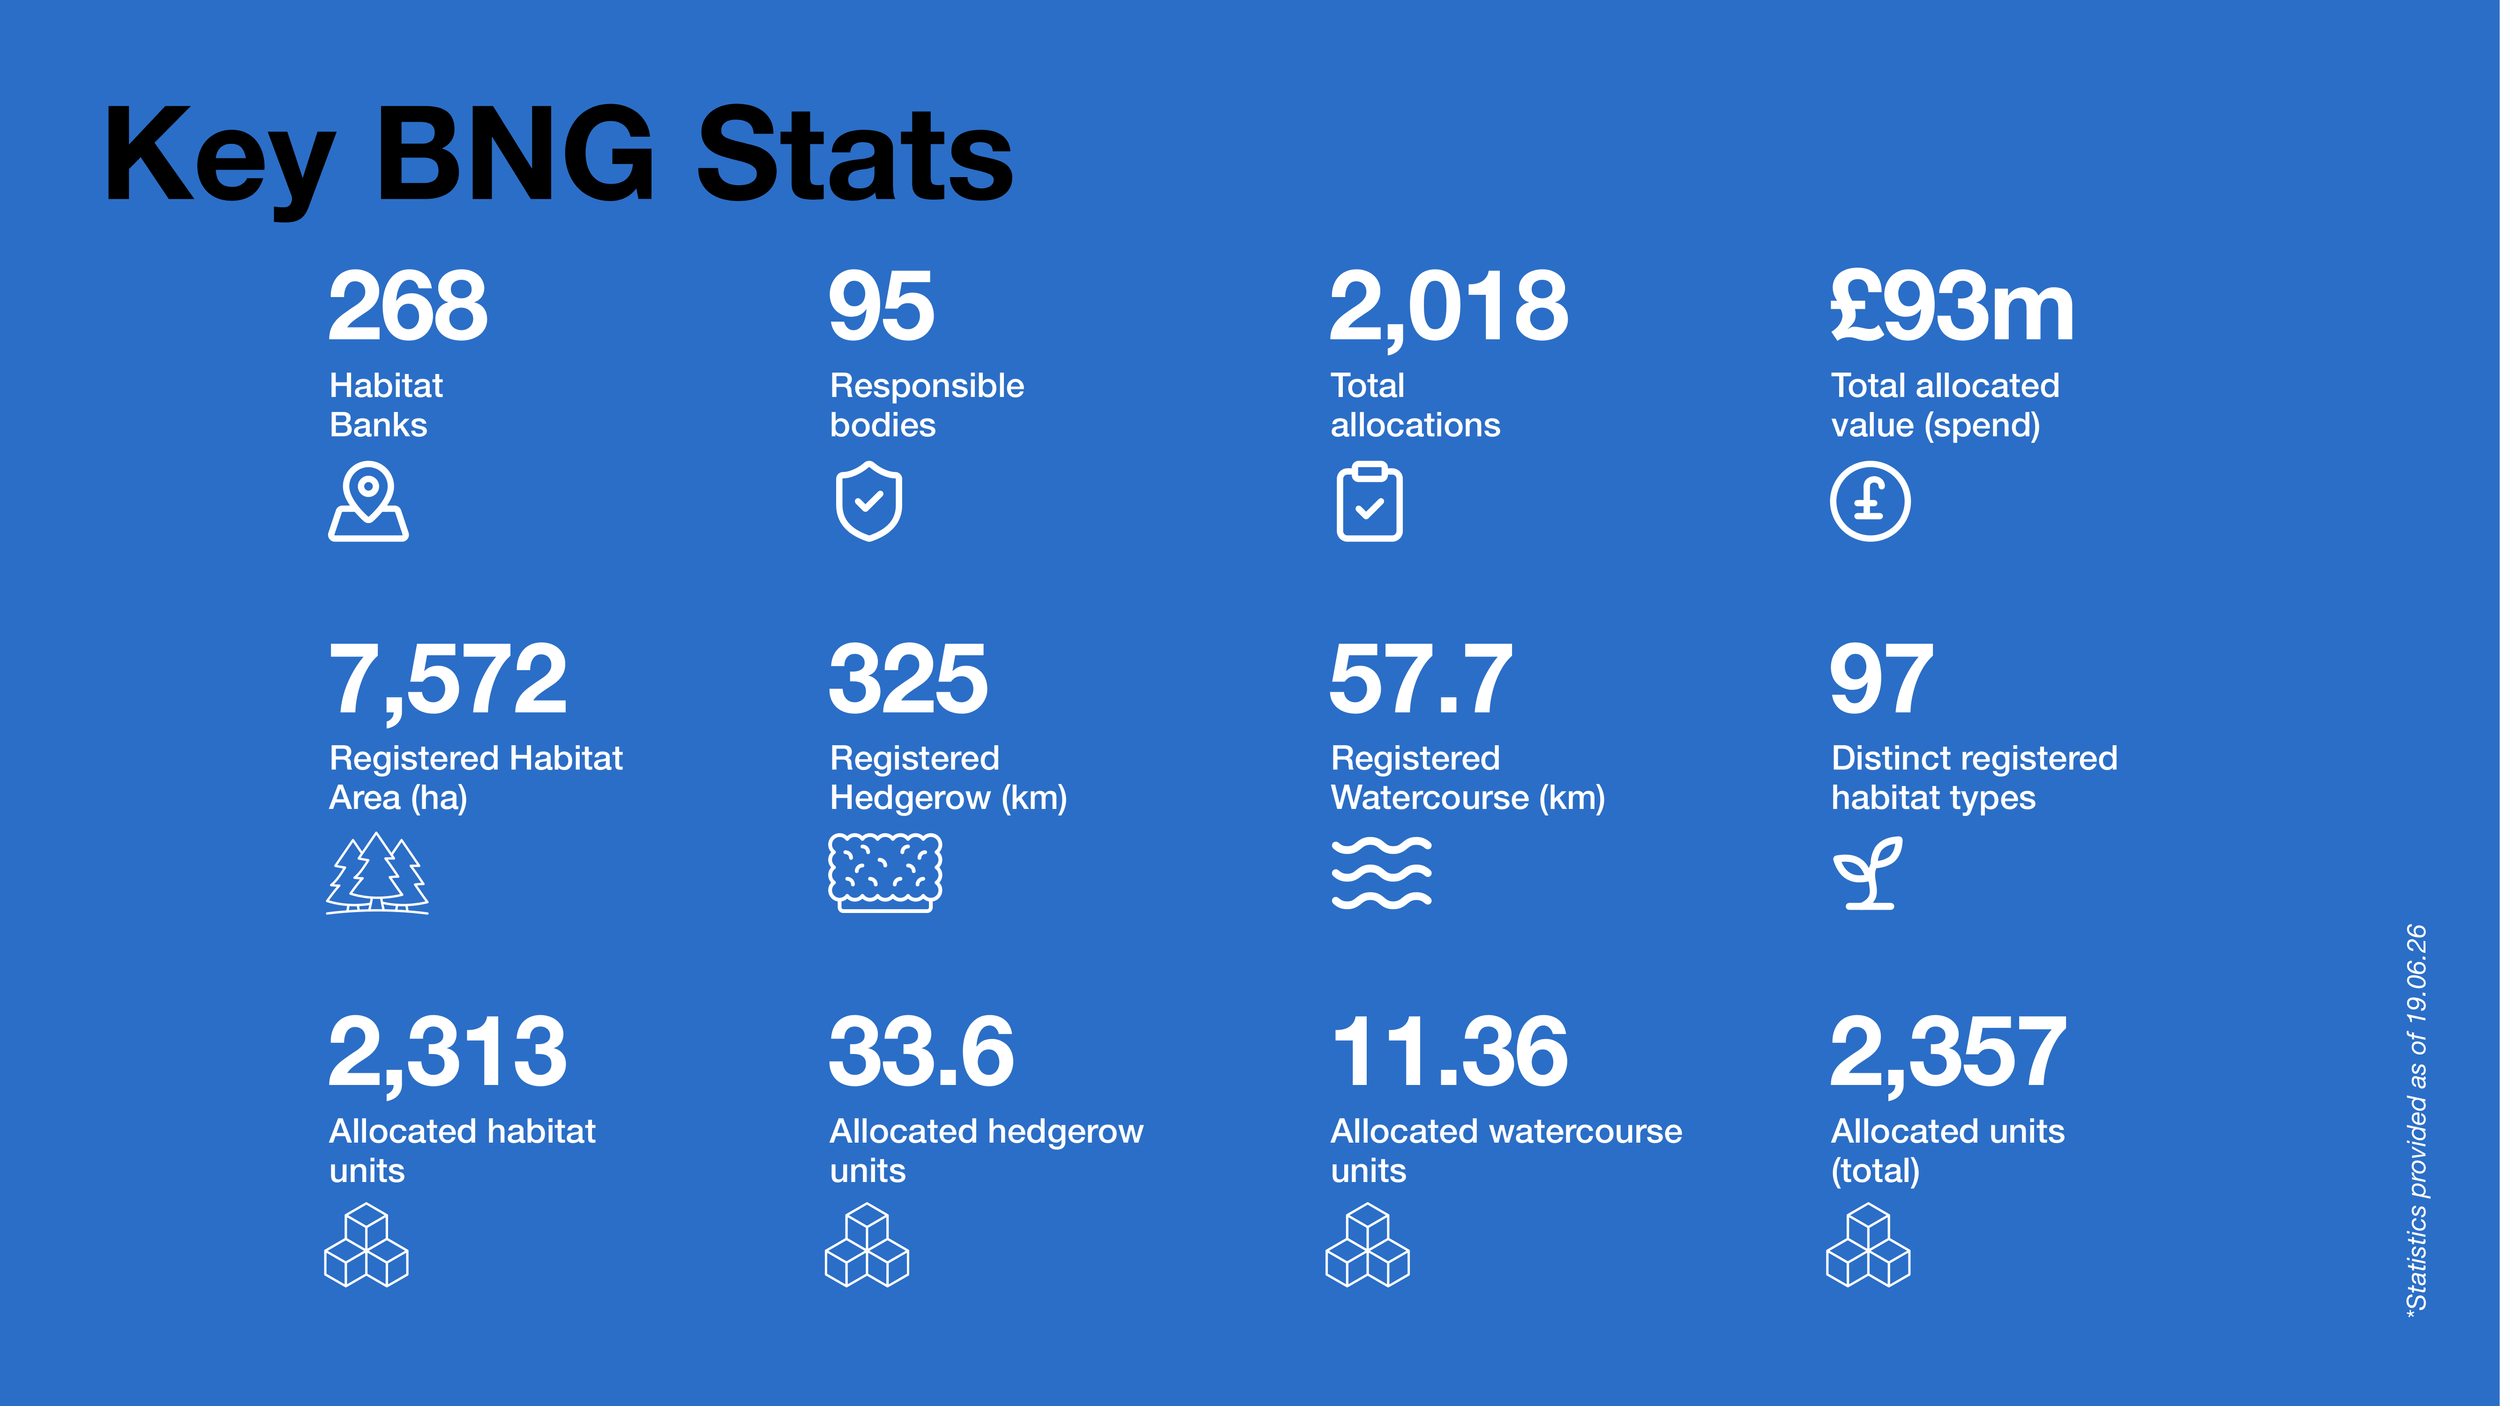
A blue infographic titled 'Key BNG Stats' displaying various statistics related to habitats, responsible bodies, allocations, and habitat types, each accompanied by icons and numerical data.

Stay up to date.

Sign up to our mailing list in order to stay up to date with news and developments on how Bio Net Gain is affecting English Commercial Property Development.