The BNG Market’s £100m Milestone - What It Means For You
The July 2026 BNG Pricing Report is here. This one's different.
For property developers, ecologists and planning consultants, Biodiversity Net Gain is a procurement challenge that requires market intelligence. Knowing what units cost, where supply is, and how the market is moving is key to enjoying a smooth process.
That's why we’ve published the BNG Pricing Report every quarter since the launch of the legislation back in February 2024. It was - and still is - the only transparent source of England-wide pricing data.
The July 2026 edition is the most comprehensive we've produced to date - drawing on pricing data from 254 habitat banks, equivalent to 95% of the registered market. For the first time we combine that pricing data with Natural England's allocation data to give a genuinely joined-up picture of what's being bought, where, and for how much.
The headline: a £100 million market
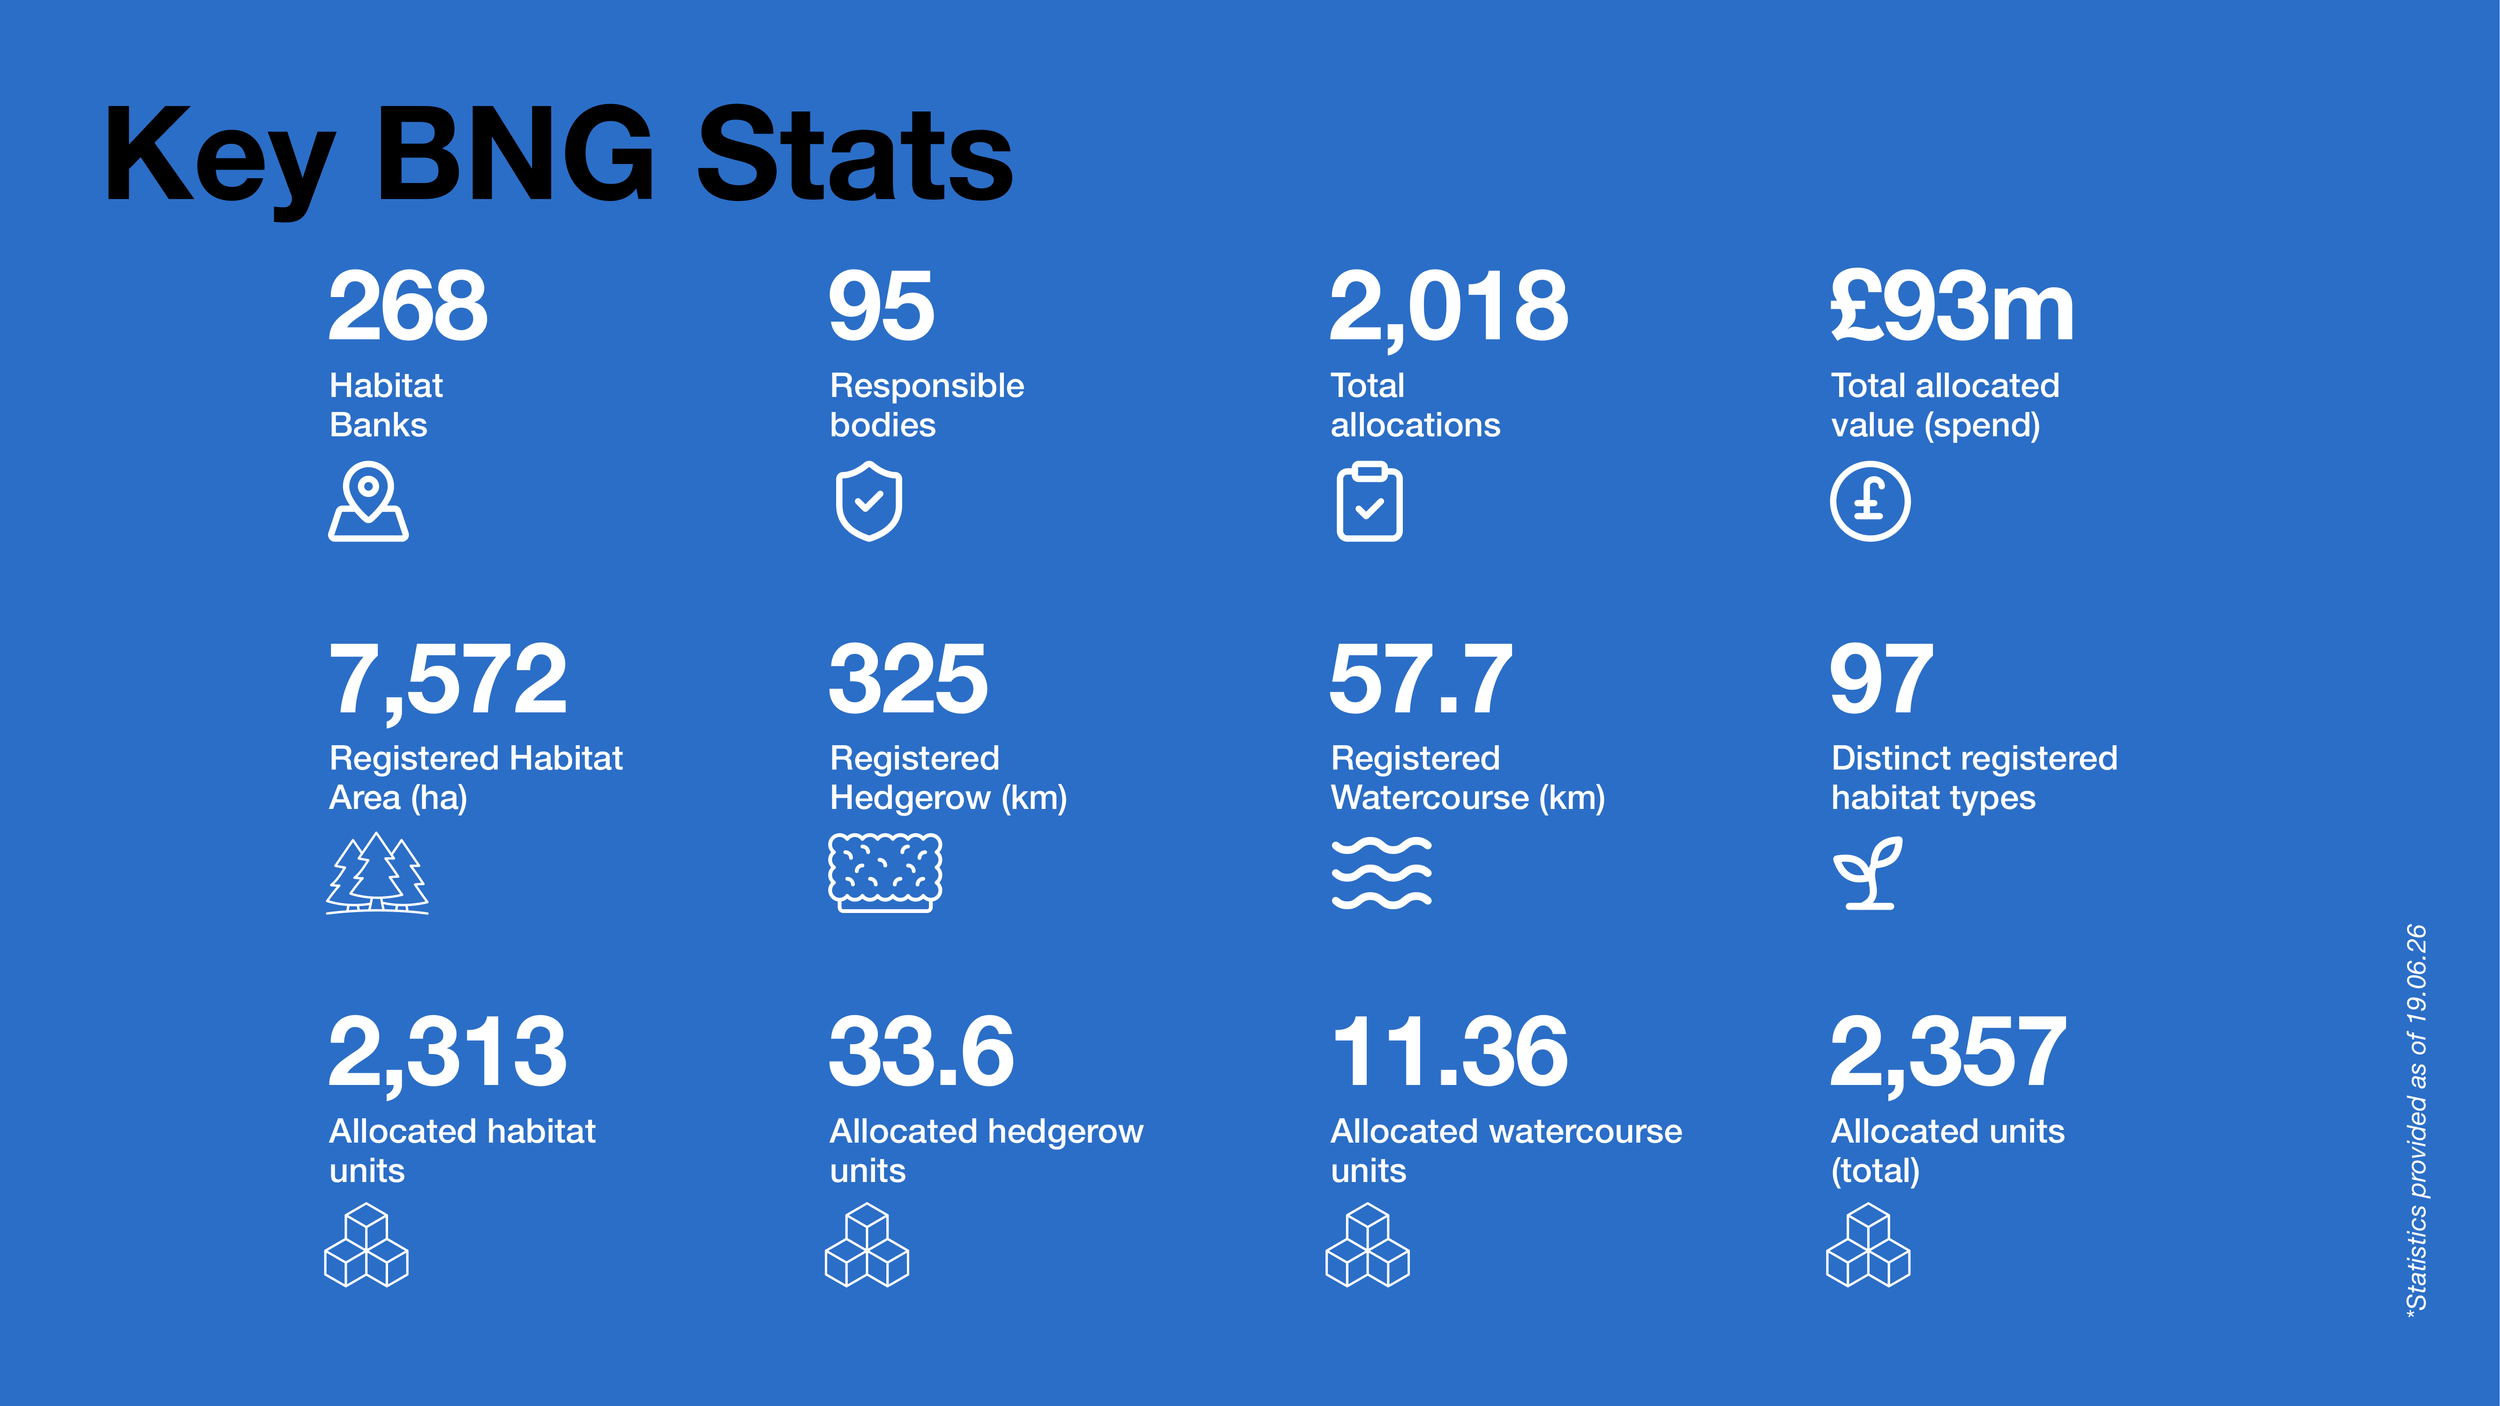
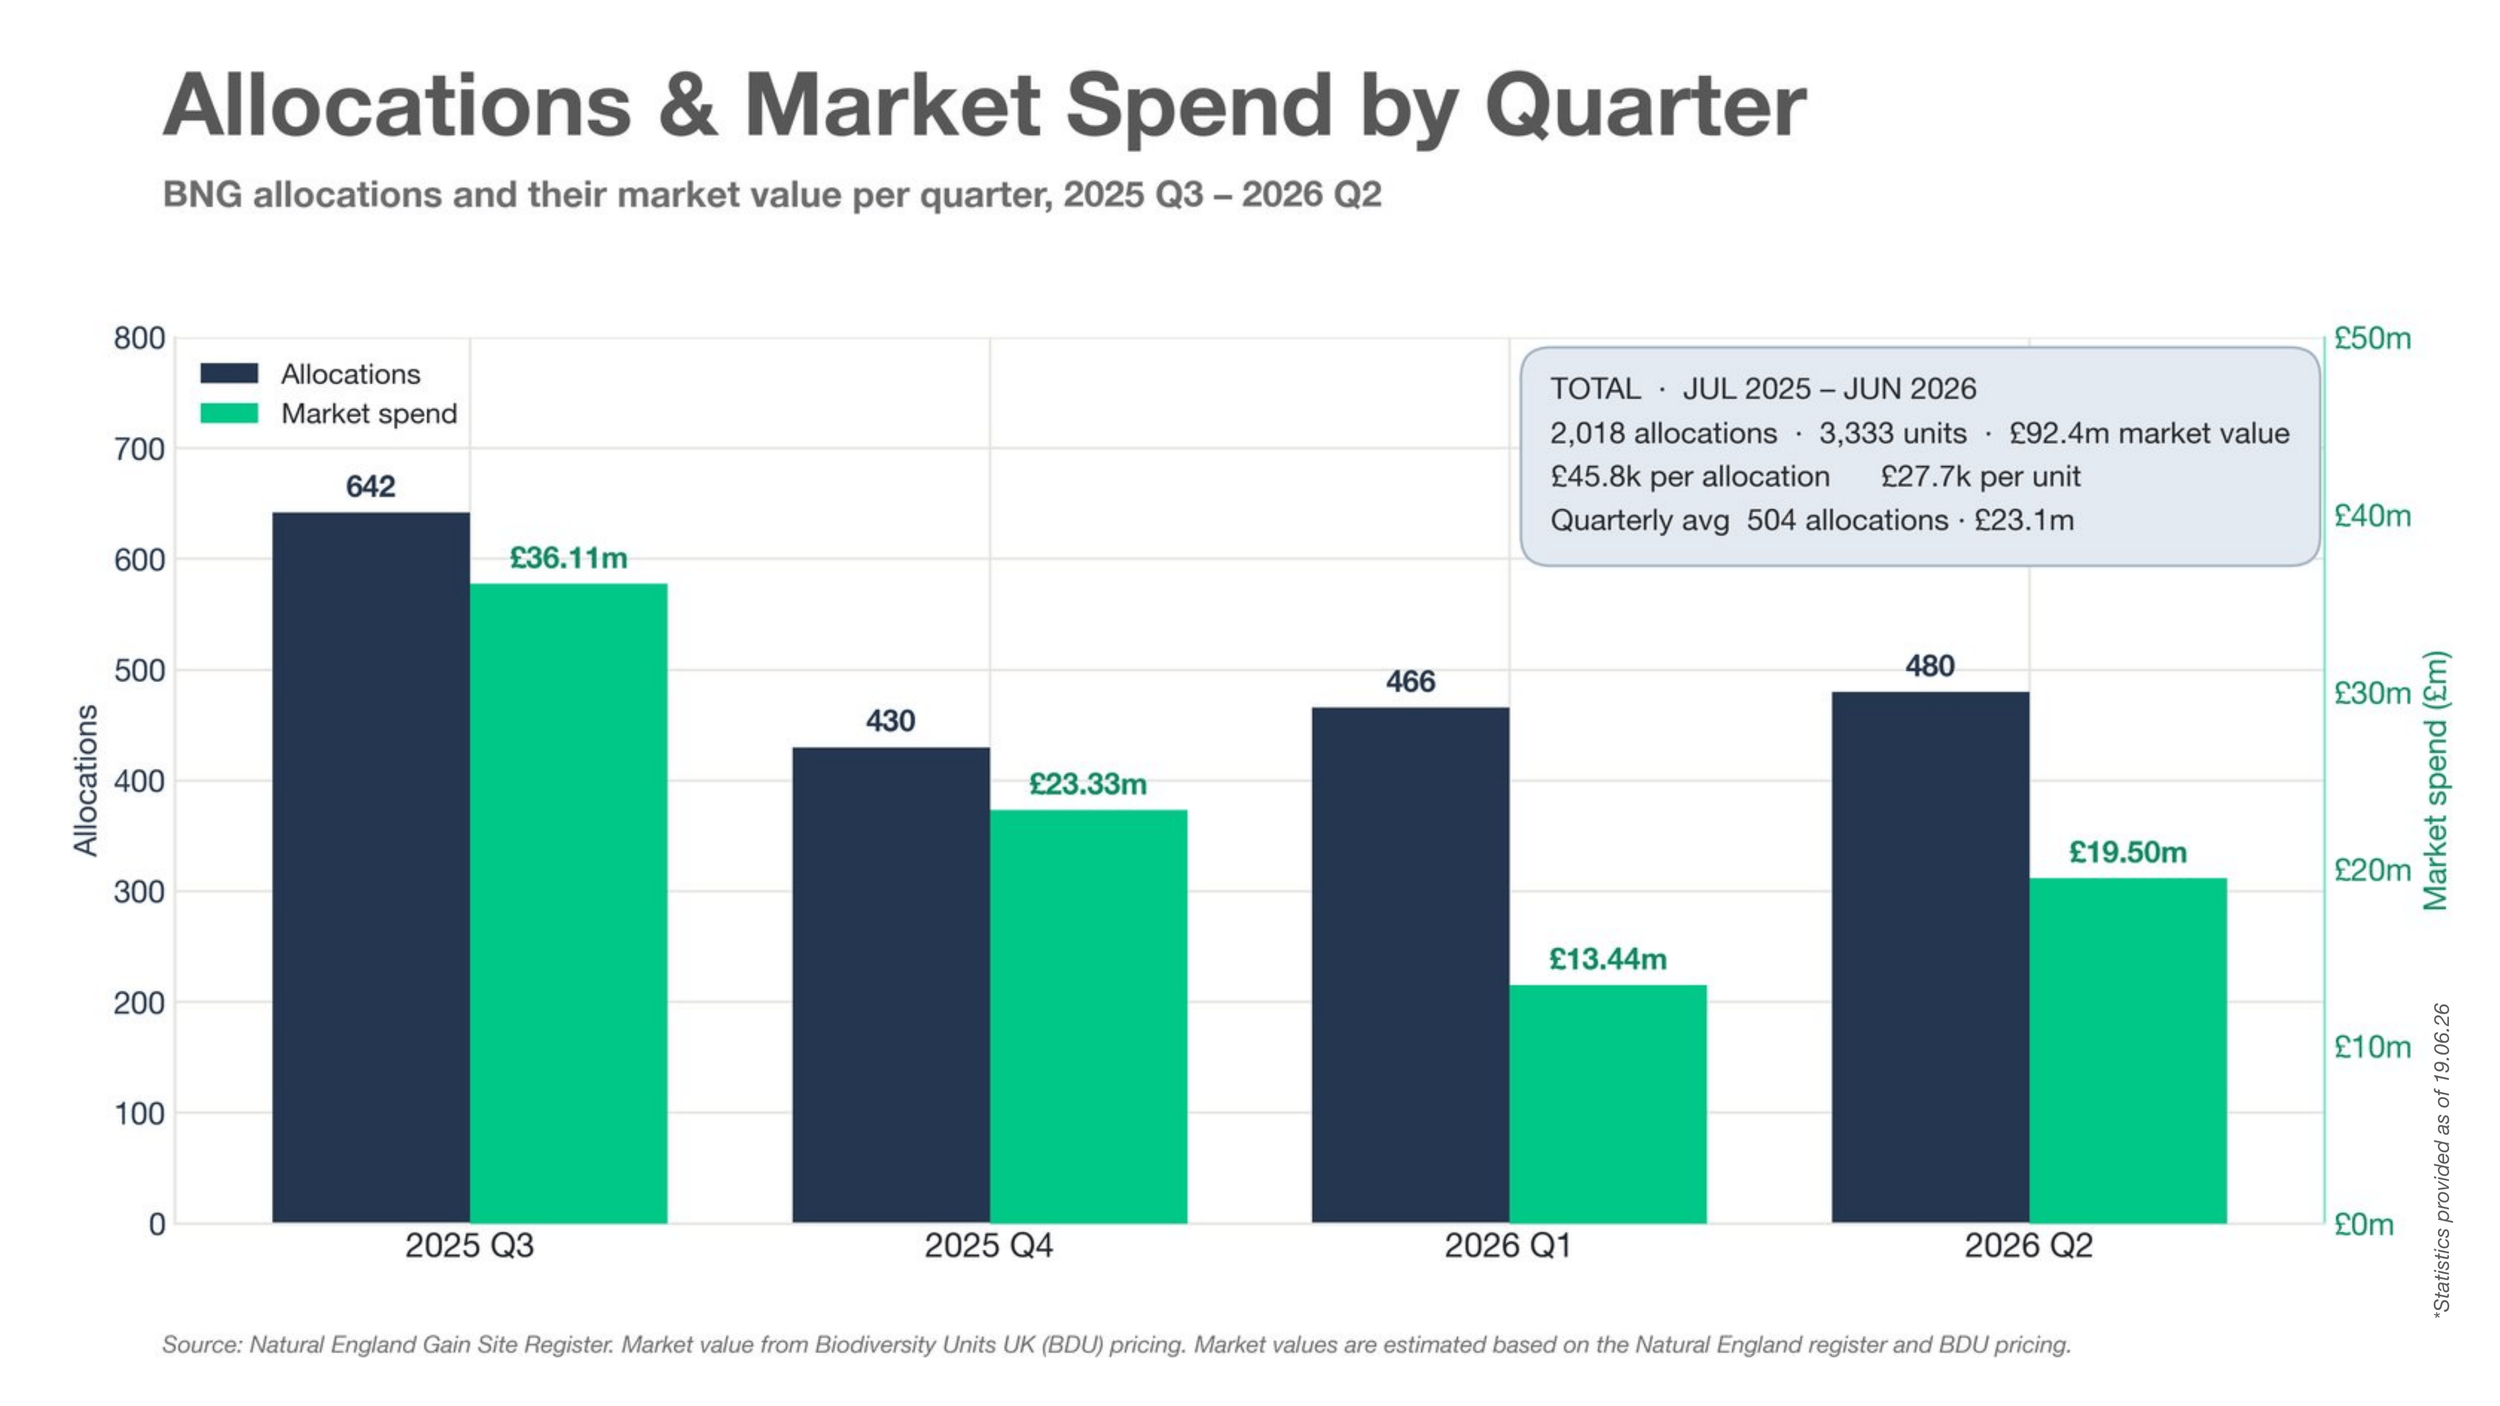
When we published our June 2025 report, we estimated the BNG market at around £33 million annually in 2025. Twelve months on, our analysis puts it at approximately £93 million for 2026.
That's nearly three times the size, one year on. The market is maturing — and for developers, that means more supply options, better processes, and more certainty when it comes to procurement.
Our long-term view remains that the BNG market has the potential to exceed £500 million annually by 2035. The trajectory is firmly in that direction.
What's new in this report
Pricing data meets allocation data - for the first time
This edition marks a significant step forward. By combining our proprietary pricing database with Natural England's allocation data, we can now analyse the market not just by price, but by volume, geography, and habitat type - all in one place.
Think of it as moving from a price list to a proper market view.
This is something nobody else has done in the BNG space. It aligns with our ambition to be “the Bloomberg of BNG”. Transparent, data-led, and genuinely useful for the people making commercial decisions.
The most purchased habitat types - a league table
For the first time, we can show which habitats are actually being bought, not just priced.
Topping the list is Other Neutral Grassland, with 1,908 units allocated and a market value of £44.85 million. Lowland Meadows and Mixed Scrub follow.
These three habitat types consistently dominate both supply and demand - which is useful to know when planning your BNG strategy, as local availability is often strongest in exactly these categories.

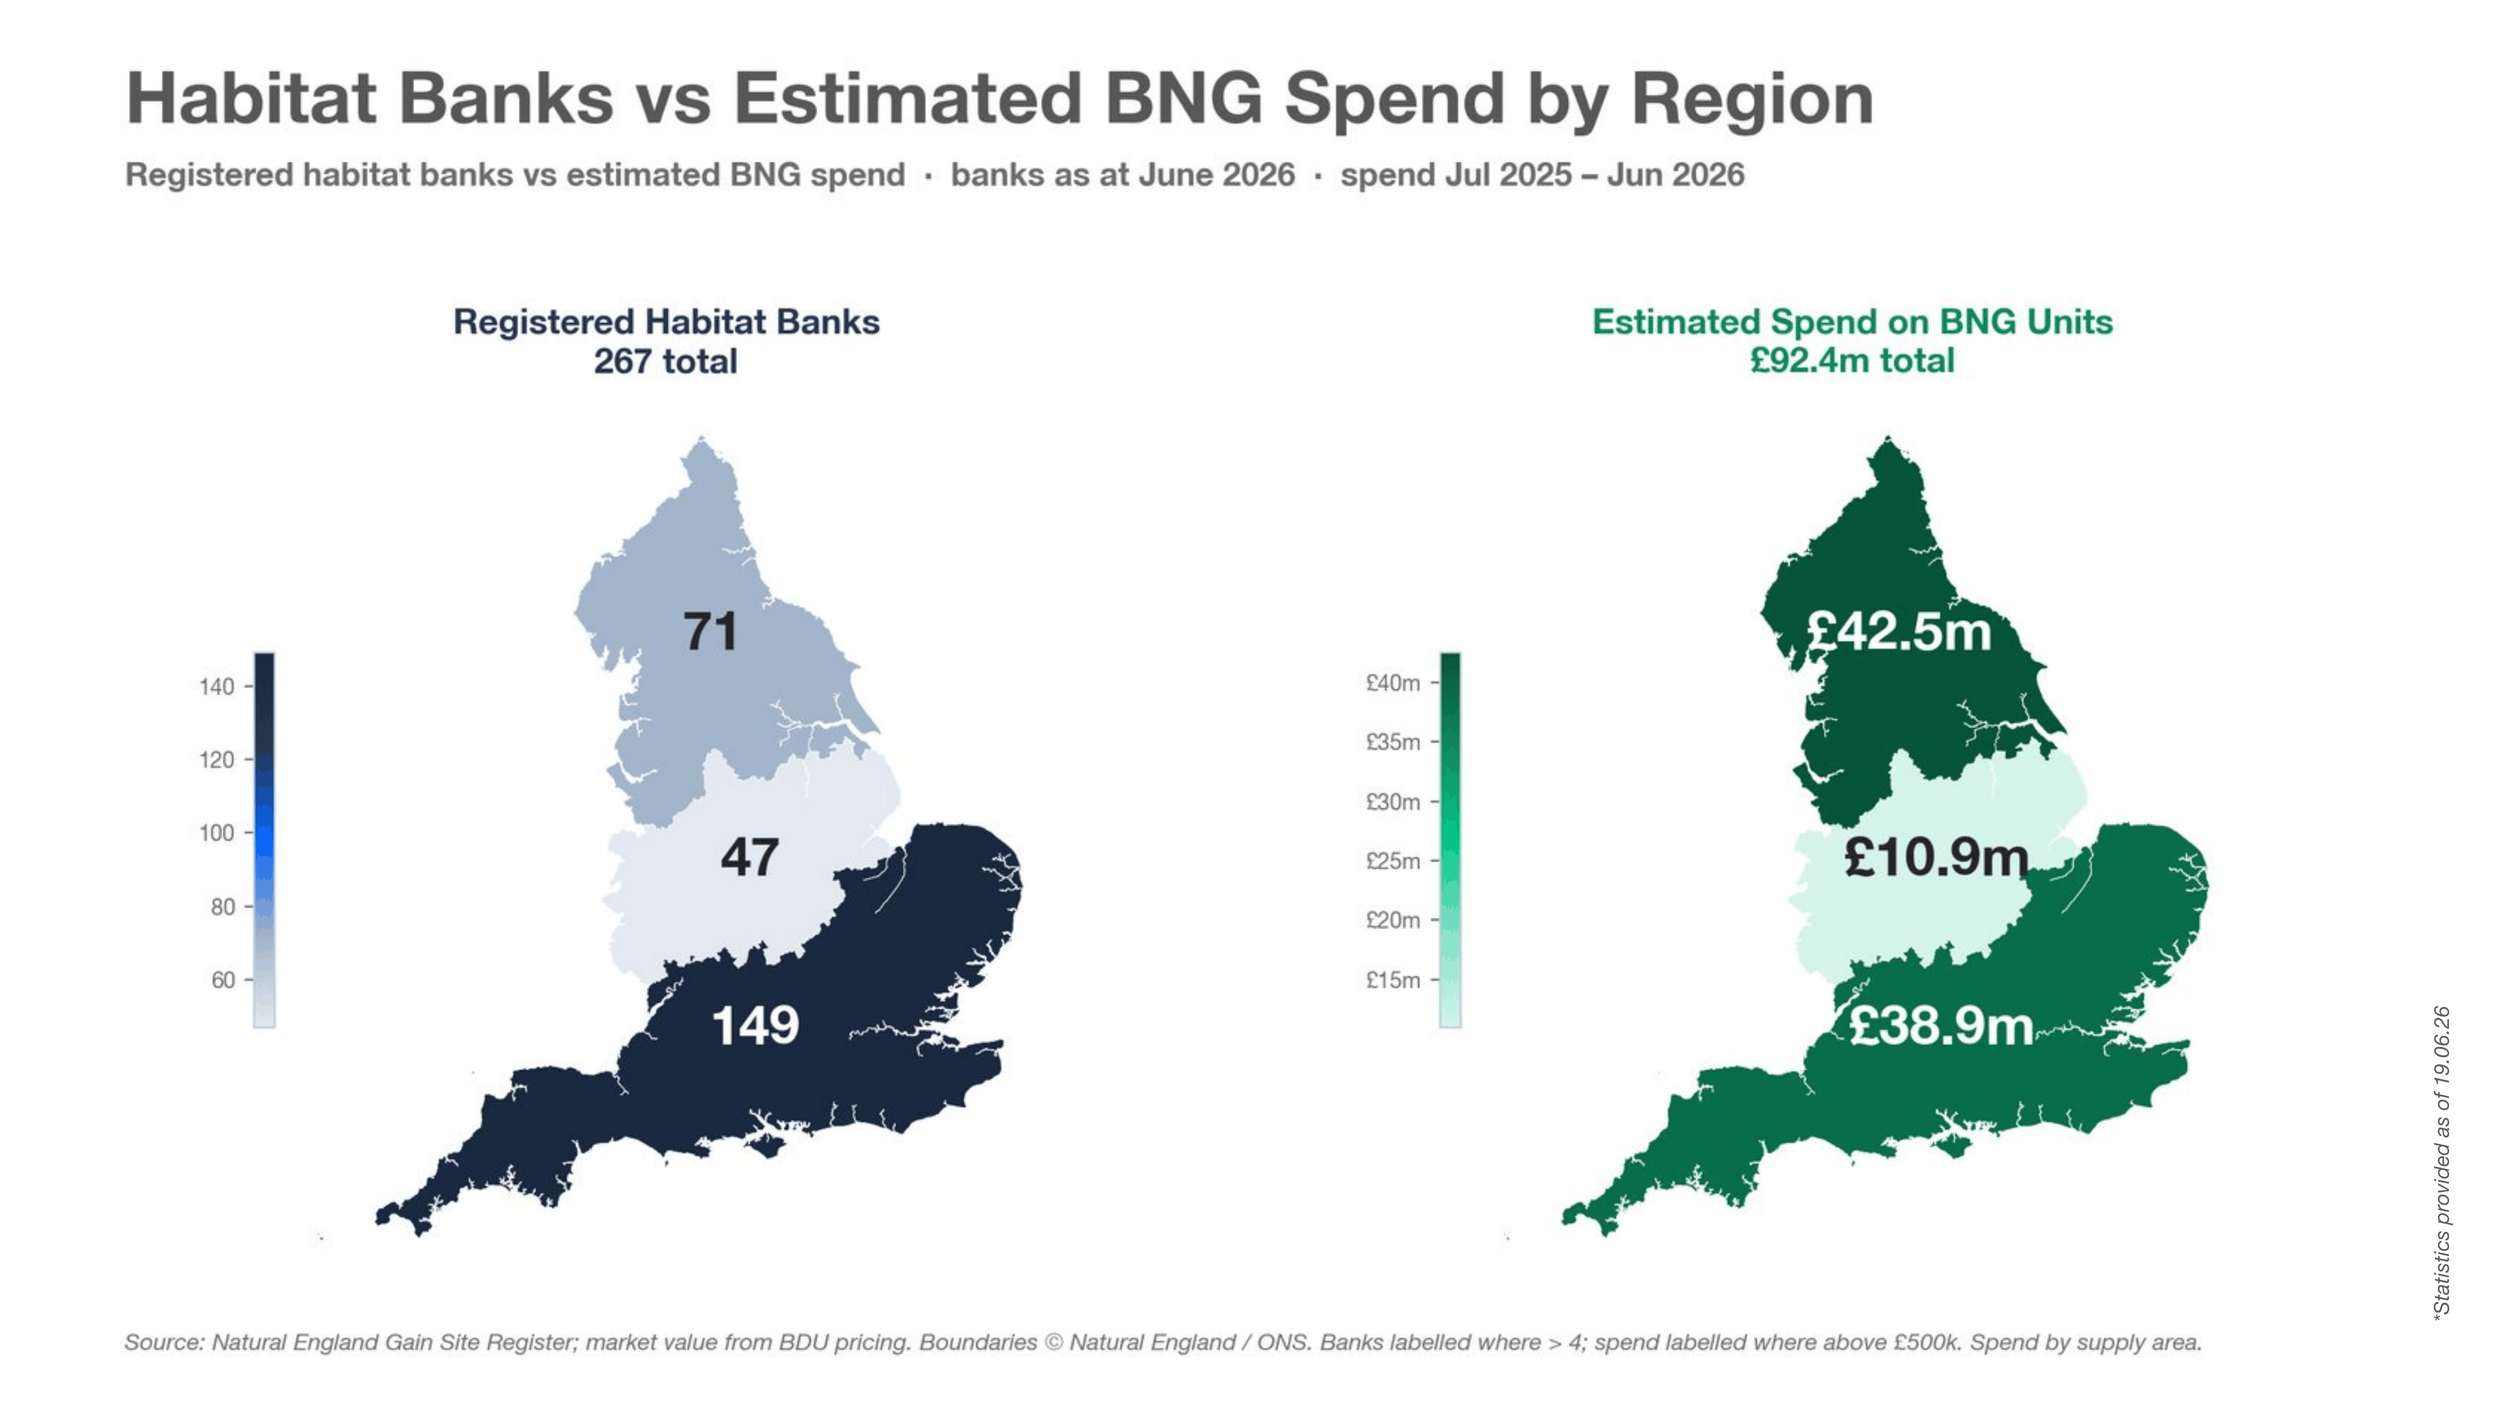
The North is outperforming
Here's a finding that might surprise you. Northern England has fewer habitat banks than the South - 71 versus 149 - yet it accounts for a larger share of market activity by both allocation volume and estimated revenue (£42.5 million versus £38.9 million in the South).
What this tells us is that demand in the North is strong relative to supply.
For developers working in northern regions, this reinforces the importance of early engagement and securing units before they're gone. For the market overall, it signals healthy activity in regions where BNG supply was slower to get started.
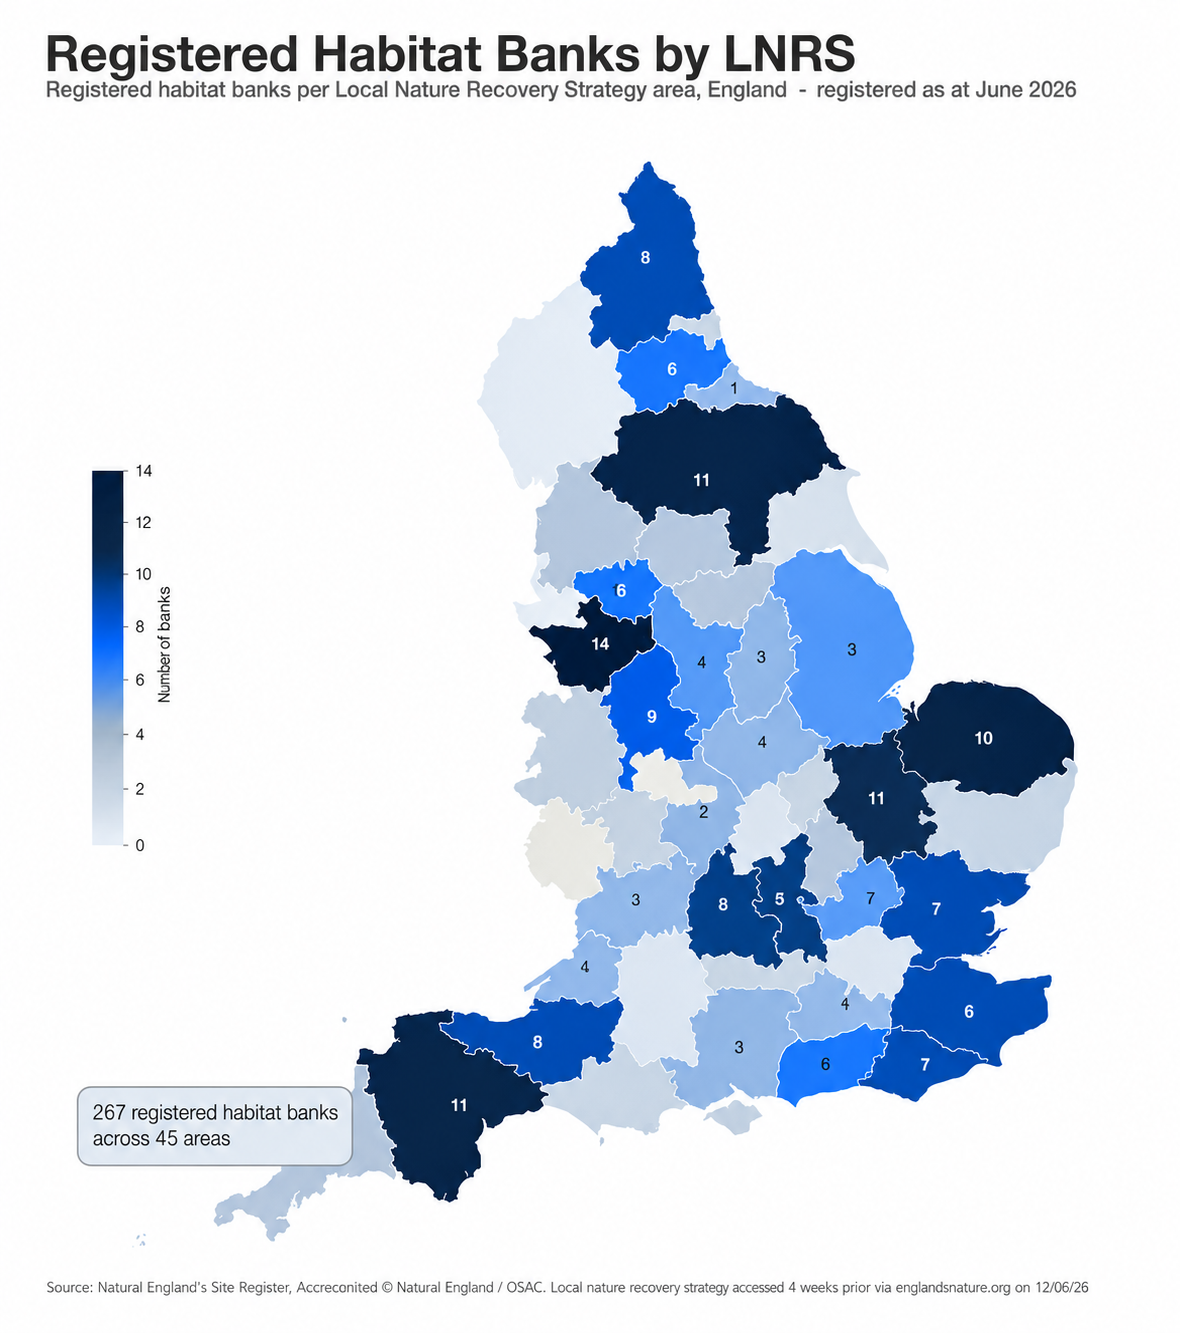
LNRS zones: more competition is coming
From the second half of 2026, Local Nature Recovery Strategy zones are expected to replace the current LPA-based approach for determining whether units are considered "local." In practical terms, this will widen the catchment areas in which habitat banks can compete for business.
In some areas where developers currently have one or two supplier options, they may soon find seven or eight habitat banks able to service the same development. Greater choice is good news - but it also means supplier visibility and market intelligence become even more important. Not all habitat banks are equal, and knowing which ones offer the right habitat types, reliable delivery, and competitive pricing will matter more than ever.
It's also worth noting that many LPAs are likely to continue favouring units sourced as close as possible to the development site.
Location will remain a factor, even as catchment areas grow.
What this means if you're buying BNG units
The market is bigger, more transparent, and more competitive than it was a year ago.
That's positive for developers. But navigating it still requires expertise - knowing where units genuinely exist, which suppliers are commercially reliable, and how to secure the right match for your specific project requirements.
Ian Hambleton, Founder and Director of Biodiversity Units UK, puts it this way:
"The July 2026 report is a real landmark for us. Combining pricing and allocation data for the first time gives the market a level of transparency it's never had before. The growth to £93 million is genuinely encouraging - it shows BNG is working as part of the planning system. But with LNRS changes on the horizon the dynamics are shifting. Our job is to make sure developers always have the clearest possible picture - and the best possible deal."
The full report is available now.
If you'd like to talk through what it means for your projects, we're happy to chat.